Real-world NOx emissions from remote sensing: An update of the TRUE rating
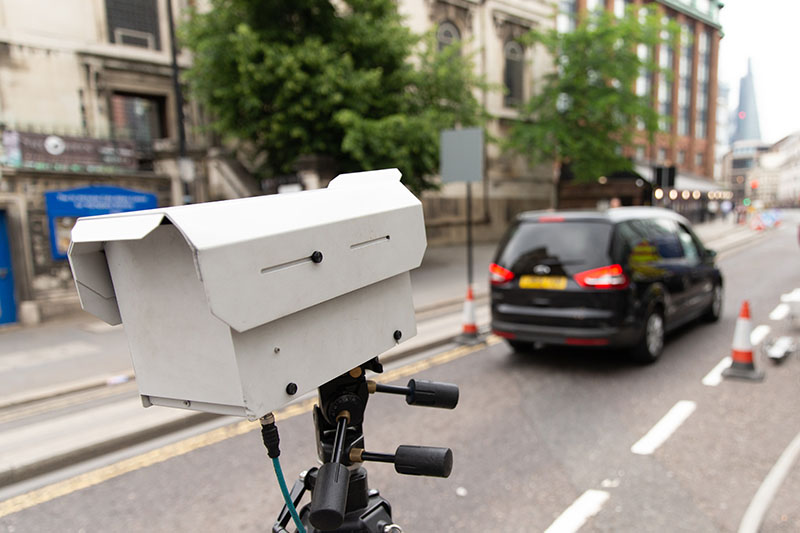
We recently finished collecting, cleaning up, and crunching the numbers from a real-world emissions measurement campaign in London using remote sensing. And we've updated the TRUE rating that categorizes vehicles based on NOX emissions to incorporate the additional data. Here are the highlights.
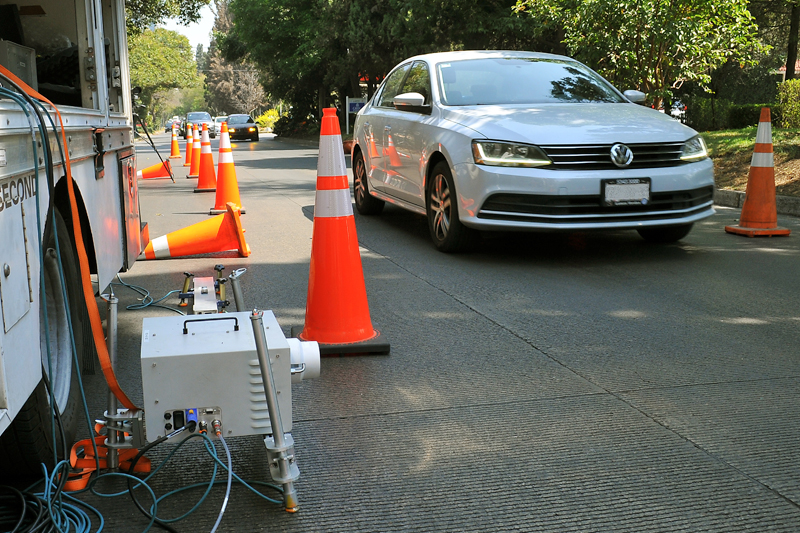
Earlier this year the Real Urban Emissions initiative (TRUE, funded by the FIA Foundation and C40 Cities) completed a project using remote-sensing technology to measure nitrogen oxide (NOX) emissions from vehicles on the road at several sites in Greater London. The London project built on work we had done to analyze remote-sensing data collected from numerous locations in Europe over the past decade. The first analysis was the basis for the TRUE rating, a simple categorization scheme that rates vehicles based on their pollutant emissions in everyday operation. The TRUE rating presently reflects only NOX emissions. Eventually it will extend to cover other pollutants. (For details on the rating system, and the methodology behind it, see here and here.)
The London testing produced more than 100,000 measurements, bringing the total amount of remote-sensing data on real-world vehicle emissions in Europe close to 1 million records. It takes a while to collect, clean up, and then crunch that many numbers, but we recently completed that task, and updated the TRUE ratings to incorporate the additional data as well. For the full results, see here. For the highlights, read on.
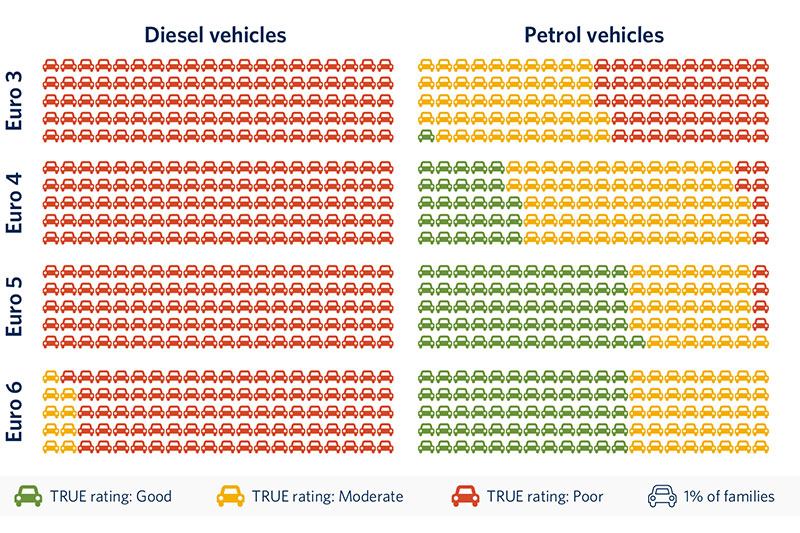
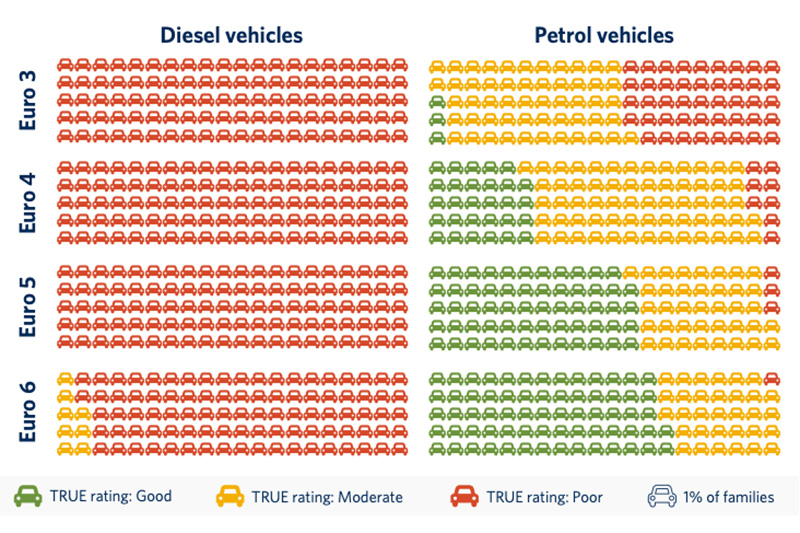
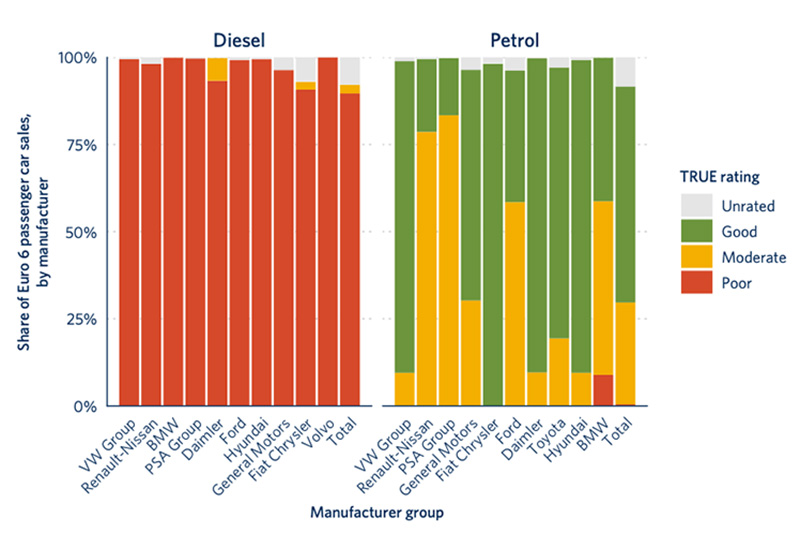
Overall, the updated ratings don't fundamentally change the conclusions of the first TRUE rating. All Euro 3 to Euro 5 diesel vehicle families are rated red. (The TRUE rating is a three-color scheme, in which green = meets pollutant limits, red = far exceeds limits, and yellow = in between; see here for a full explanation.) Euro 6 diesel cars are mostly red, with just under 10% rated yellow, and none rated green. In contrast, some petrol vehicles built to every standard back to Euro 3 are rated green, and the proportion increases with each successive emissions standard (see Figure 1).
The new data didn't generate many changes in the initial TRUE ratings for specific vehicle families, either. Fewer than 5% of vehicle families received a different rating in the update (see table below). There are a few reasons why a rating might have changed. If, for example, a vehicle family did not clearly fall into the green or red group (meaning that the 90% confidence interval of the mean spans any of the thresholds), it received a yellow initial rating; additional measurements can shrink the confidence interval so that it is clearly green or clearly red and justify changing the rating. Vehicle emission performance may also change over time—for example, increase as the emission controls deteriorate with age, or decrease thanks to a recall to fix a problem. And testing conditions can have an effect. The London campaign took place November to February, with relatively low ambient temperatures, which can influence vehicle exhaust NOX emissions (see Figure 2).
The new data allows TRUE to rank about 117 additional vehicle families covering 509 new models. In particular, the data contains twice as many measurements for Euro 6 vehicles. That additional data raised the number of Euro 6 vehicle families we can rate with confidence from 89 to 136. The TRUE rating now covers 98% of vehicles using internal combustion engines sold in Europe in 2017.
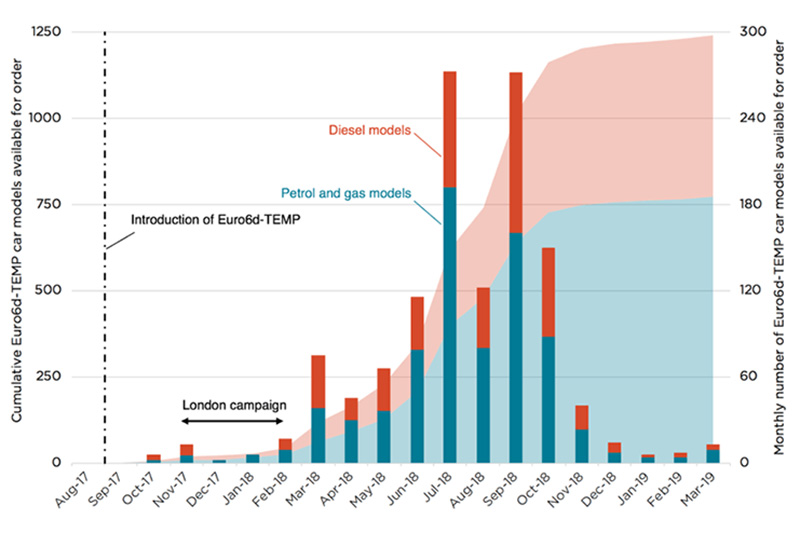
When the TRUE rating debuted, the European Automobile Manufacturers Association, ACEA, complained that it didn't accurately reflect improved emissions from Euro 6d-temp vehicles that are compliant with the RDE regulation. At the time the first TRUE data was collected no such vehicles were on the road, and even when the initial report was released (June 2018) only a few were. And that remains the case in the London data, collection of which was complete in February 2018. The Allgemeiner Deutscher Automobil-Club, the General German Automobile Club, provides a list of all Euro 6d-temp vehicles available for order (retrieved 3 December 2018). Figure 3 shows that only a few models were available for order at the time of the London campaign. Only 12 models were diesels, less than 1% of the RDE-compliant models available for order on 3 December 2018. That is probably much less than 1% of all new registrations, because vehicles that are not compliant with RDE can still be registered until September 2019.
The Euro 6d-temp diesel models can be grouped into three vehicle families: those using the 1.5 and 2.0l from the PSA group, and the 2.0l from Volvo. The 1.5 engine from PSA is a particularly good candidate to track with remote sensing because it uses a new engine-block size. Even though this engine became available to order only a month after the introduction of the new regulation, not a single one was measured in London. RDE-compliant vehicles are expected to emit lower NOX emissions that their predecessors. But the London campaign shows that there are still not enough of them on the road to see the benefits (see Figure 3).
The additional data also allowed us to rate families that have a relatively low market share and couldn't be included in the initial rating because the data didn't include a sufficient number of samples. That is the case for niche market vehicles such as the gasoline 5.5l engine of the Mercedes AMG (sport division of Daimler), the 6.4 l engine from Jeep, or again the 3.8l engine only sold by Porsche. Another new rating, the BMW group 1.2l engine installed in vehicles of the Mini brand, is the worst of all Euro 6 petrol and the only Euro 6 petrol vehicle to receive a red rating—though it still performs better than the average Euro 6 diesel. Vehicles using the FCA 2.2l diesel engine are the highest emitters of all Euro 6 vehicles, dethroning the previous champion, the FCA diesel 2.0l.
The cleanest diesel is the Euro 6 Mercedes 2.0l, with average emissions getting close to the green threshold. When introduced, that engine was considered the state of the art in diesel emission control. It uses a close-coupled sDPF (particulate filter with coating to reduce nitrogen oxides) to enhance the reduction of NOX emissions at low exhaust temperature, combined with a selective catalytic reduction catalyst positioned behind for further NOX control.
As I write this we're processing and analyzing the data collected in another remote-sensing emissions measurement project in Paris that ended in July 2018. We'll combine that data with the data we have from the CONOX project and the London campaign, and use it to (among other things) refine and extend the TRUE rating further.
| Fuel | Emission standard | Manufacturer | Engine displacement (1) | Old rating | New rating |
|---|---|---|---|---|---|
| Petrol | Euro 2 | BMW | 4.4 | Moderate | Poor |
| Petrol | Euro 2 | Ford Motor Company | 1.2 | Poor | Moderate |
| Petrol | Euro 2 | Mitsubishi | 1.6 | Moderate | Poor |
| Petrol | Euro 3 | Daimler | 0.6 | Moderate | Poor |
| Petrol | Euro 3 | Daimler | 1.9 | Moderate | Good |
| Petrol | Euro 3 | Daewoo | 1.6 | Moderate | Poor |
| Petrol | Euro 3 | Ford Motor Company | 2.0 | Moderate | Poor |
| Petrol | Euro 3 | Honda | 1.8 | Moderate | Poor |
| Petrol | Euro 3 | PSA Group | 2.2 | Moderate | Poor |
| Petrol | Euro 3 | PSA Group | 2.9 | Good | Moderate |
| Petrol | Euro 3 | Suzuki | 1.3 | Poor | Moderate |
| Petrol | Euro 3 | Volvo | 1.8 | Poor | Moderate |
| Petrol | Euro 4 | BMW | 2.0 | Poor | Moderate |
| Petrol | Euro 4 | Daimler | 0.7 | Moderate | Good |
| Petrol | Euro 4 | Ford Motor Company | 1.6 | Poor | Moderate |
| Petrol | Euro 4 | Ford Motor Company | 2.0 | Moderate | Poor |
| Petrol | Euro 4 | General Motors | 1.1 | Moderate | Poor |
| Petrol | Euro 4 | Mazda | 1.4 | Moderate | Good |
| Petrol | Euro 4 | Mazda | 2.3 | Moderate | Good |
| Petrol | Euro 4 | PSA Group | 2.9 | Good | Moderate |
| Petrol | Euro 4 | Subaru | 2.0 | Moderate | Poor |
| Petrol | Euro 4 | Volkswagen Group | 4.8 | Moderate | Good |
| Petrol | Euro 5 | Fiat Chrysler Automobiles | 1.2 | Moderate | Good |
| Petrol | Euro 5 | Hyundai Motor Company | 1.2 | Moderate | Good |
| Petrol | Euro 5 | Honda | 1.3 | Moderate | Good |
| Petrol | Euro 5 | Honda | 2.0 | Moderate | Good |
| Petrol | Euro 5 | Mitsubishi | 1.6 | Moderate | Good |
| Petrol | Euro 5 | PSA Group | 1.4 | Good | Moderate |
| Petrol | Euro 5 | Suzuki | 1.0 | Moderate | Good |
| Petrol | Euro 5 | Suzuki | 2.4 | Moderate | Good |
| Petrol | Euro 5 | Volkswagen Group | 1.0 | Moderate | Good |
| Petrol | Euro 5 | Volkswagen Group | 4.0 | Moderate | Good |
| Diesel | Euro 6 | BMW | 3.0 | Moderate | Poor |
| Diesel | Euro 6 | Jaguar Land Rover | 3.0 | Moderate | Poor |
| Petrol | Euro 6 | BMW | 3.0 | Moderate | Good |
| Petrol | Euro 6 | Daimler | 3.0 | Moderate | Good |
| Petrol | Euro 6 | General Motors | 1.4 | Moderate | Good |
| Petrol | Euro 6 | Hyundai Motor Company | 1.4 | Moderate | Good |
| Petrol | Euro 6 | Hyundai Motor Company | 1.6 | Moderate | Good |
| Petrol | Euro 6 | Renault-Nissan | 1.0 | Moderate | Good |
| Petrol | Euro 6 | Renault-Nissan | 1.6 | Moderate | Good |
| Petrol | Euro 6 | Toyota | 1.2 | Good | Moderated |
| Petrol | Euro 6 | Toyota | 1.3 | Moderate | Good |
| Petrol | Euro 6 | Toyota | 2.5 | Good | Moderate |
| Petrol | Euro 6 | Volkswagen Group | 1.0 | Moderate | Good |


